Dynamic Images or "Infographics" give users the ability to create data-driven infographics. These infographics can then be added to presentations and reports, where they can be configured to use data interactions from other artifacts - grids, charts, slicers and variables - to create responsive graphical displays of information that are more intuitive to understanding the underlying analysis and are interactive for the end user.
Dynamic images may be based on the box stock images available in Illustrate, or on images that you import. For details about importing your own images, click here.
Dynamic PQL Functions
Image Properties
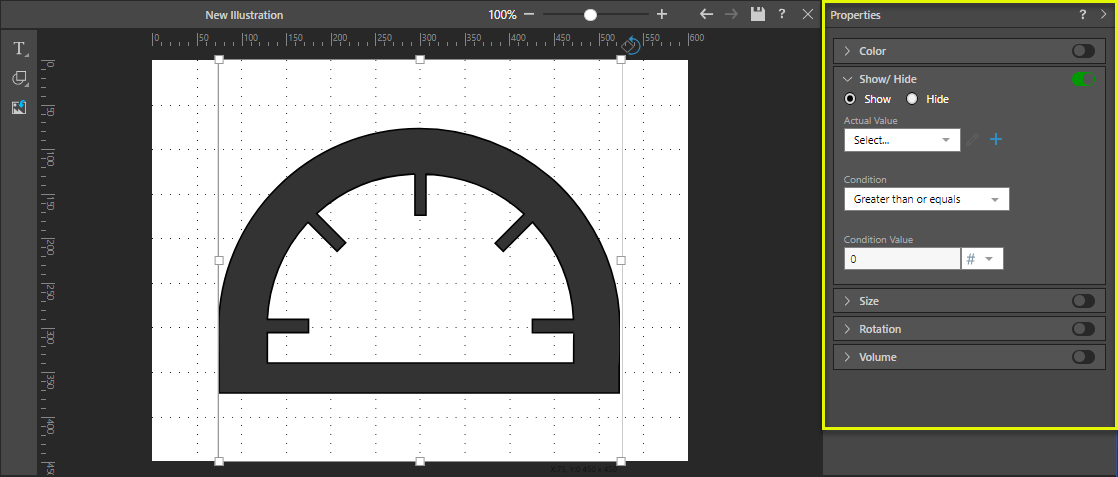
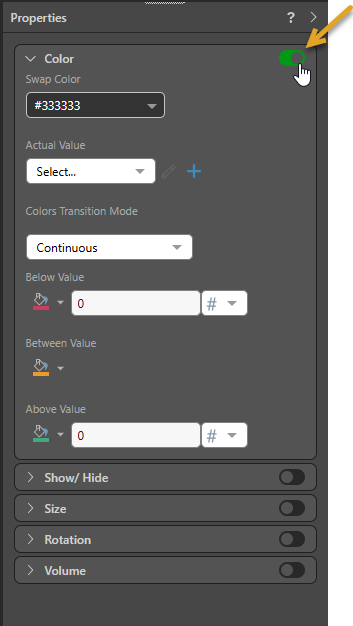
To construct a dynamic image, you must configure at least one of its dynamic properties (yellow highlight below). These properties can be used to drive the image color, show or hide the image, or drive its size, rotation, or volume.
- Click here to learn more about the dynamic Properties.
Setting Dynamic Image Properties
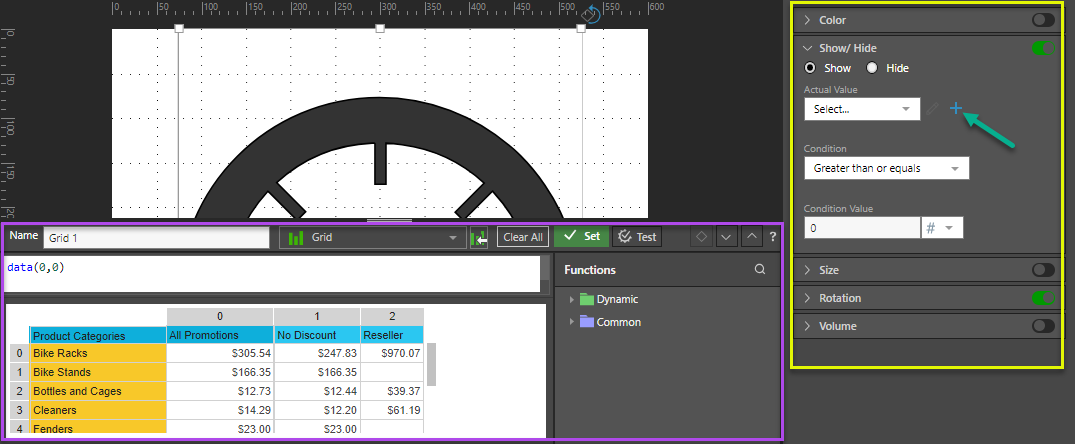
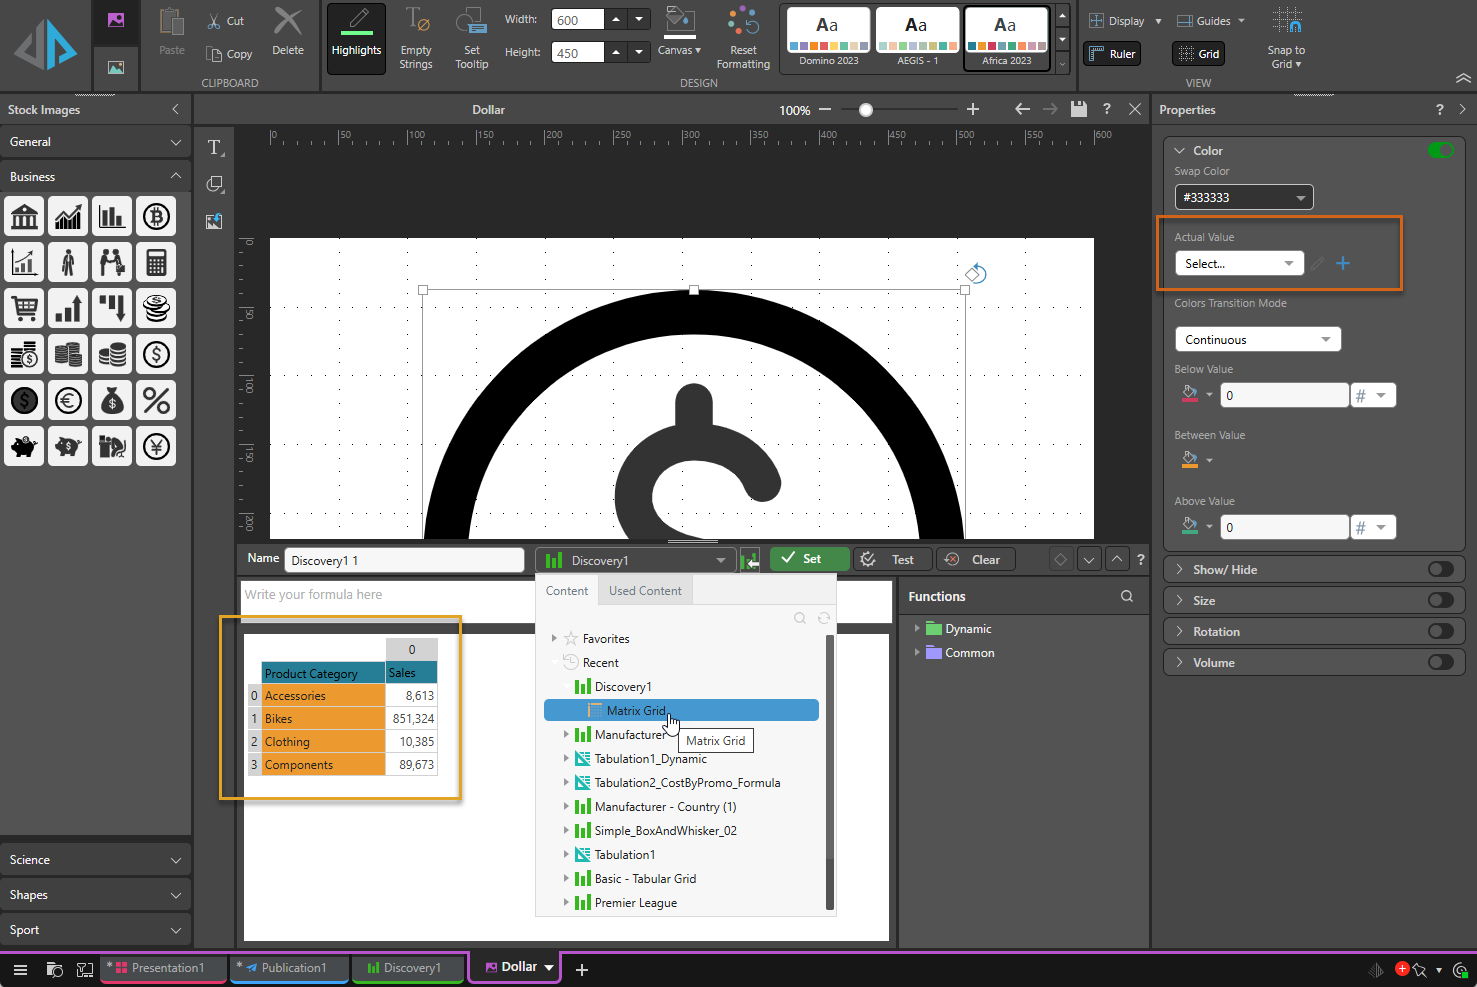
Dynamic images are configured by injecting values from the Dynamic Text Editor into the relevant properties (yellow highlight above).
To open the editor:
- Add an image to the canvas. Tip: You can import your own image or select a stock image in Illustrate.
- With the image selected, go to the Properties panel. For details of the Properties that you can set in this panel, see Dynamic Properties.
- Enable and configure the property that you want to make dynamic.
Set the Actual Value (that is, the value that drives the dynamic text or image) through the Dynamic Text Editor (purple highlight below). The Condition, Minimum, or Maximum values, may be driven by a given static value or by a dynamic formula.
- Click here to learn about the dynamic Properties.
Use the Dynamic Text Editor
The Dynamic Text Editor is used to configure dynamic formulas that will then drive the selected dynamic property for your image.
From the Dynamic Text Editor:
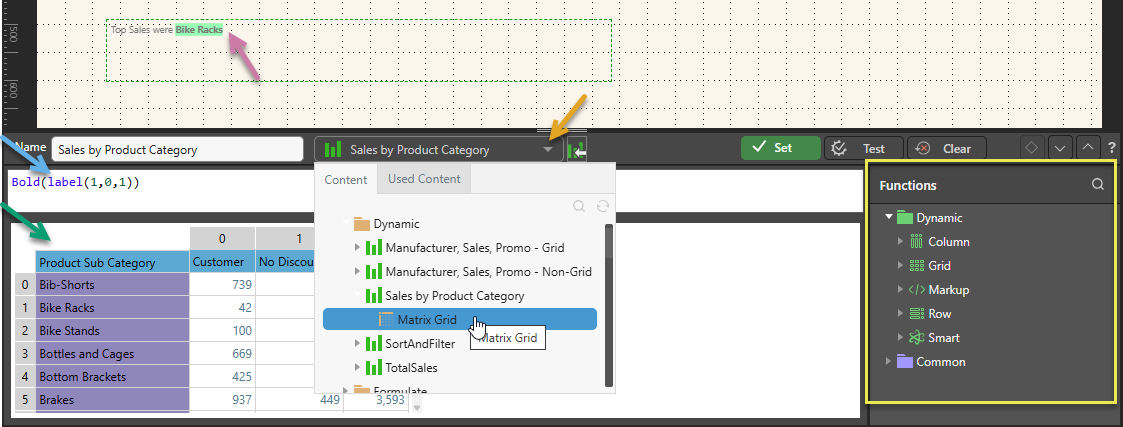
- Open the Content dropdown list (orange arrow below), find and select the grid you want to base your dynamic formula on. You must select a grid from a Discovery or a Visual Area from a Tabulation.
- Write your dynamic text expression in the script editor:
- Use the PQL Functions library (yellow highlight) to add SQL expressions to your script.
- Select the relevant cells from the grid (purple highlight) to populate the given PQL expressions.
Dynamic PQL Functions
The Pyramid Query Language (PQL), pronounced "Prequel," is a language built into Pyramid's PYRANA engine to allow users to construct queries that can run against the many SQL data stacks that Pyramid can query natively. PQL includes a vast array of operations and functions that allow users to query data and build analytical logic.
The Dynamic Text Editor exposes Dynamic and Common functions. Dynamic functions are a set of specialized methods that are designed to act on a given query's result set. Common functions are a set of methods that are found in most programmatic and mathematical function libraries. These functions are used to perform logic on basic data without concern for data structures, context, or even source.
To add a PQL function from the library to the script editor, simply double click on it. You will then need to inject values into the function.
Using the LLM AI-Driven PQL Function
Pyramid's Generative AI integration enables you to use AI to generate scripts and images, dynamic text and infographics, calculations and lists, schedules, colors, and more. It allows you to generate a range of content, including complex code, simply by providing a text prompt.
Tip: You can use the LLM PQL function (from the Common PQL functions) to generate dynamic text, adding the results to custom tooltips, text fields, or into your PQL formulas. While this function cannot tell you about your data set, it can add additional information and background to your presentation or publication.
Warning: When using LLMs, your assets are generated using public domain algorithms. This can produce erroneous and inconsistent or random results. Use at your own risk.
Examples
Step 1
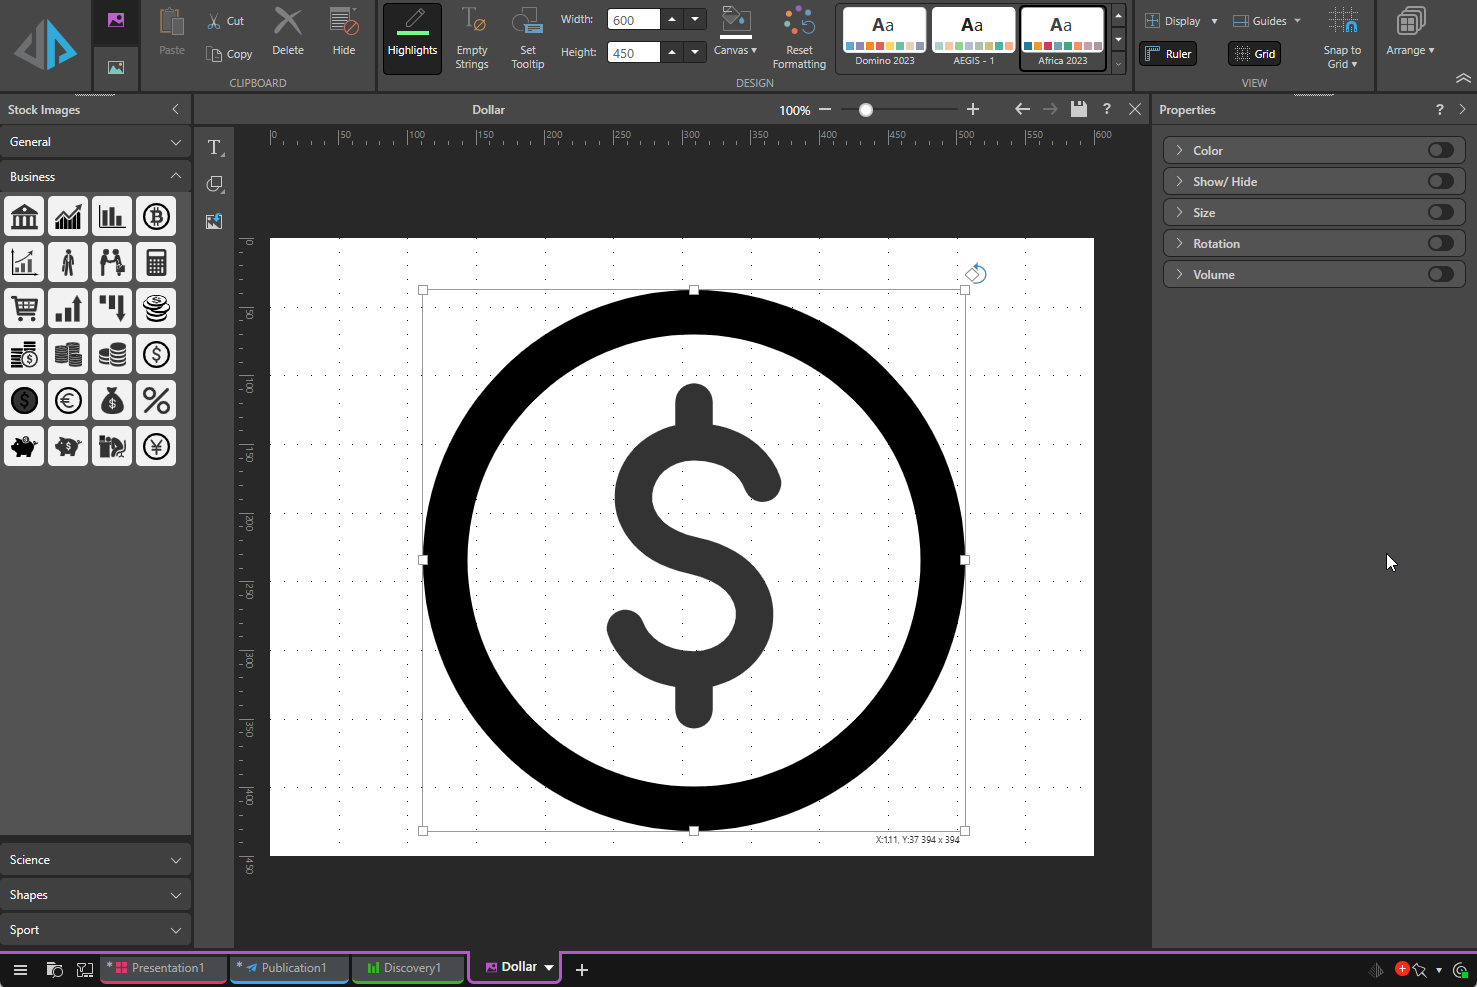
Open Illustrate, choose an image from the Stock Images panel, and drag it onto the canvas. The stock images panel is divided thematically into different categories. Alternatively, users can add their own images by importing them or dropping them directly onto the canvas from their folder location. It is important to note that different properties will be available for different image types.
Move and resize your image as desired, holding the shift key to maintain the aspect ratio.
Step 2
In the Properties panel on the right, enable the Color panel by toggling its slider (orange arrow below).
You can configure your dynamic image to change color, show or hide, change size, rotate, or change in volume, based on data values, by choosing the corresponding option in the Properties panel.
Step 3
- Click + (plus) alongside the Actual Value field. A new dialog opens at the bottom of the page.
- Open the Content panel, find and select the content you want to base your dynamic text on. Once selected, the grid will appear in the editor.
From this window, you can also write expressions using the dynamic functions in the dropdown lists.
Step 4
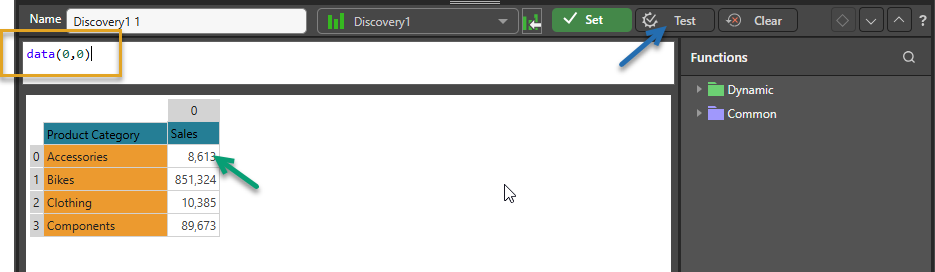
Select the cell containing the value that should be represented in the dynamic image (green arrow). In this example, the image will be configured to provide a color indication of whether sales goals for accessories have been met.
Once you've made your selection, click Test (blue arrow) to verify that the cell has been selected successfully.
Step 5
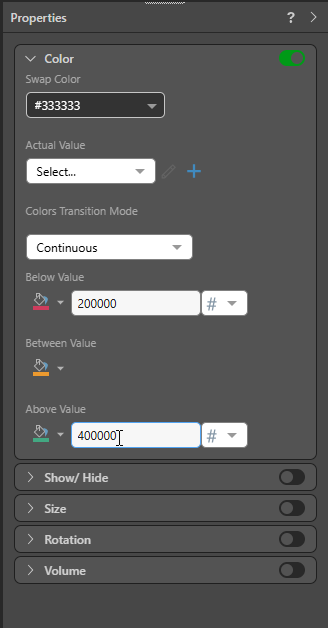
Now, in the Color panel, type insert values into Below Value and Above Value fields.
In this example, 200 000 was written in the Below Value window, and 400 000 in the Above Value window. This means that whenever the value of accessories sales falls below $200,000, the image will be red. When the value is above $400,000, it will be green, and whenever it falls between these values the image will be yellow.
Tip: Click the paint buckets to select different colors.
Step 6
Next, click Set, and save your image.
For details describing how to use your dynamic illustration in a presentation or publication, see: